OSP Metrics
Proposals
NOTE: Proposals are shown by preaward unit. Internal (MSU-), Research Gifts, and BusinessCONNECT proposals are excluded. Prepared by MSU Sponsored Programs (EM) 12/4/2025.
February 2025 - July 2025 Proposals by College
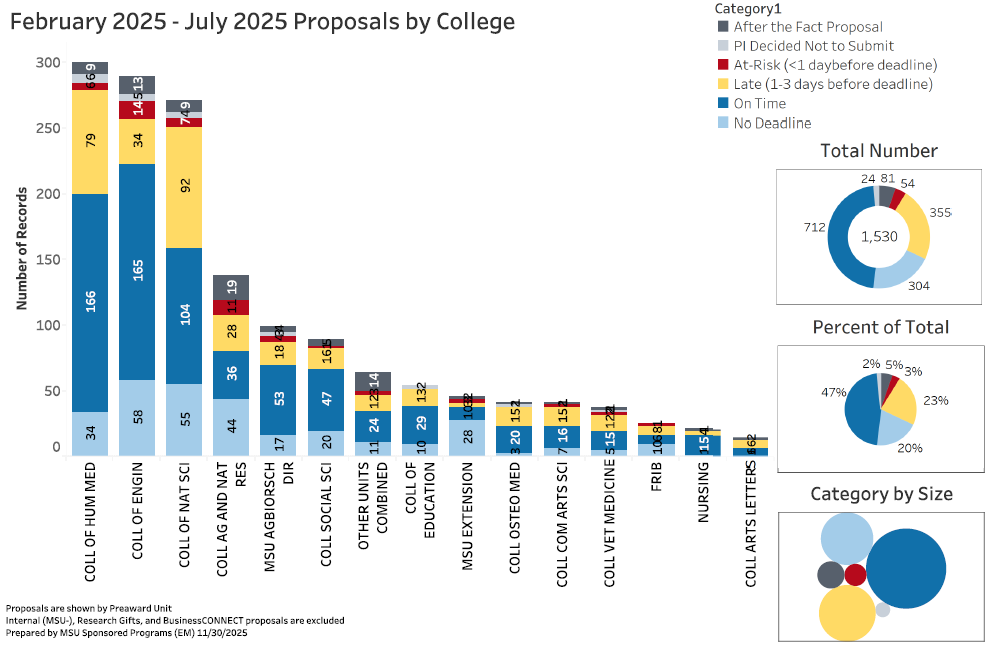
Visit the Proposal Processing Status Details page to review the proposal submission information in table form.
Awards
NOTE: Awards charts reflect agreements for which beginning and end dates are available. Not included in this chart: modifications and outgoing subawards.
After assessing the total processing time of a sample of awards, it was found that awards were with OSP approximately 30% of the time and with other entities (e.g. departments/colleges, compliance offices, sponsor, etc.) 70% of the time.
Awards Processing Time by Month Completed (7/1/24 - 7/31/25)
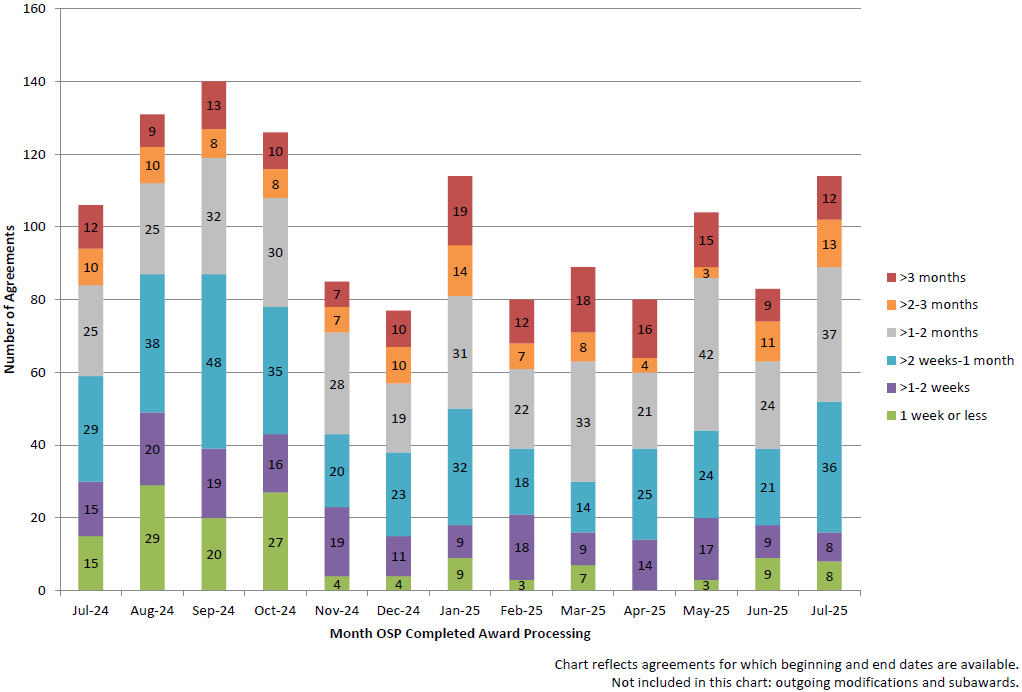
The chart above shows processing time for 1,367 awards from July 1, 2024 to July 31, 2025. Overall about 53% of all awards were processed within one month.
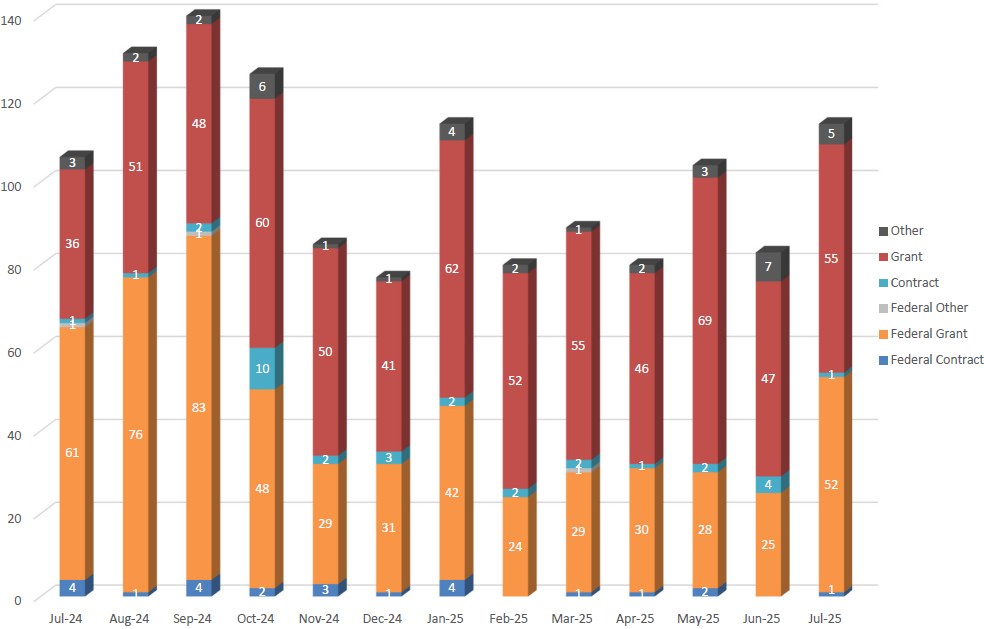
Awards Processed by Month by Agreement Type (7/1/24 - 7/31/25)
CGA Metrics
Awards Group
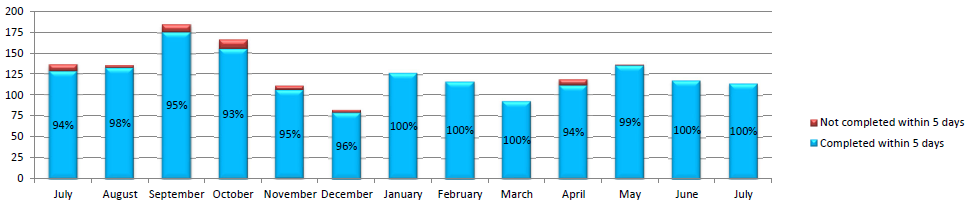
New Awards Finalized in KR & Accounts Routed in KFS
(Target is 5 Days from Receipt from OSP)
Total accounts routed from July 2024 - July 2025 are as follows.
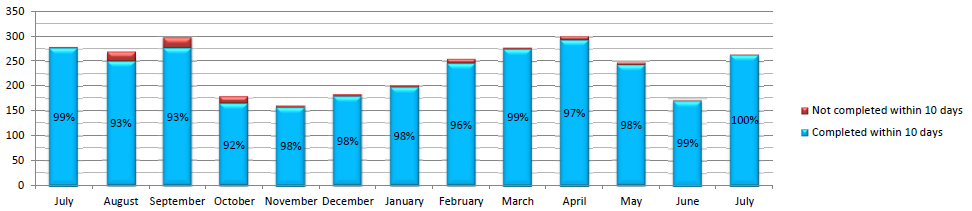
Amendments Completed in KFS and AE (Target is 10 Days to Process Fully From Receipt)
Total amendments processed from July 2024 - July 2025 are as follows.
New Accounts Created by Fiscal Year
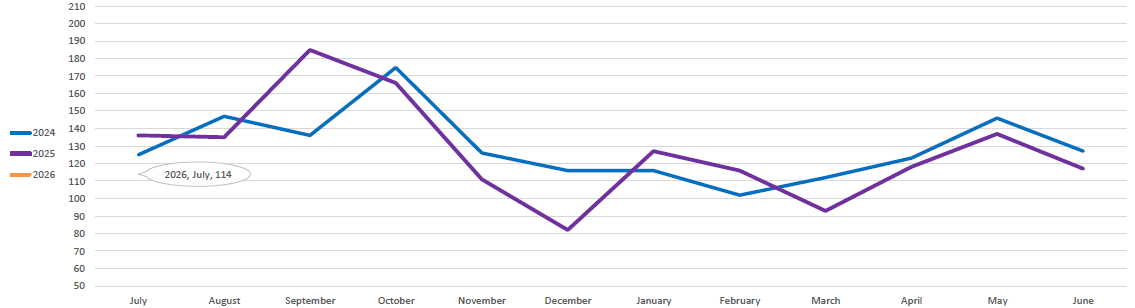
Start of FY26 as of July 2025: 114 Accounts created
Number of Effort Report Certifications Per Month by Fiscal Year
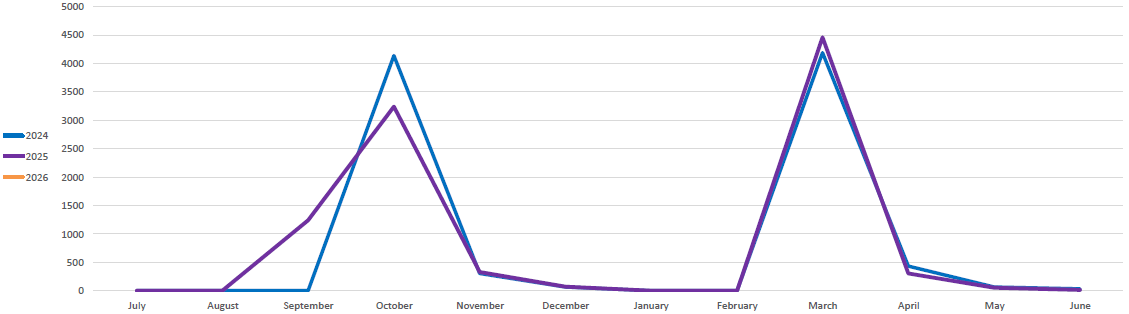
Total certifications each period:
FY 2024:
Period 1: 4504
Period 2: 4720
FY 2025:
Period 1: 4870
Period 2: 4825
FY 2026:
Period 1: Not Open for Certification
Period 2: Not Open for Certification
Audit & Compliance Group
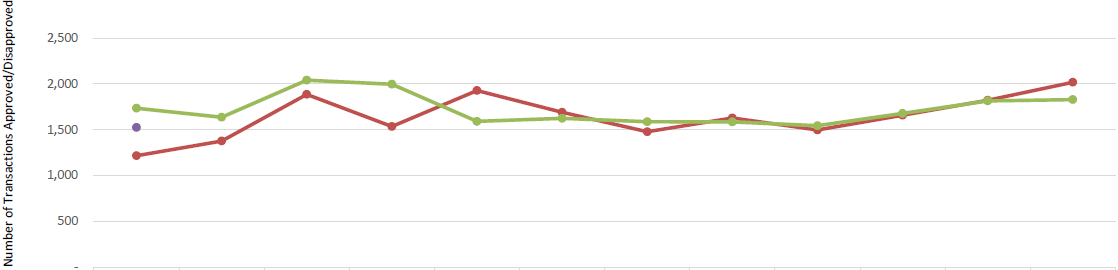
Turnaround Time of KFS/SAP Transactions Approved/Disapproved by CGA's Audit & Compliance Group
Operational Goal: Review transactions within 3 business days and approve/disapprove within 5 business days. Units are given additional time after initial CGA review to provide documentation.
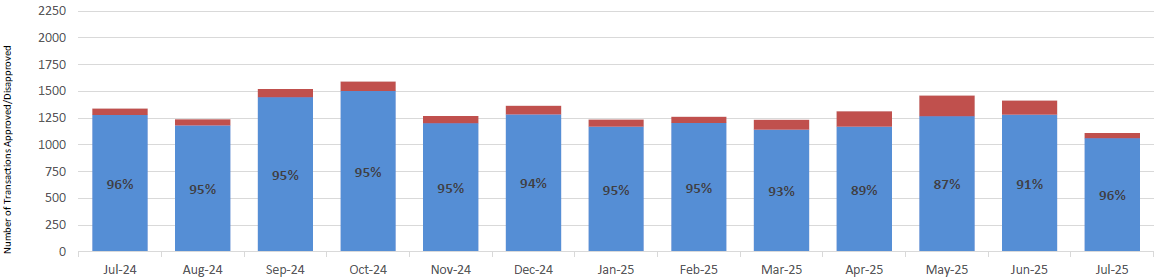
Number of Transactions Approved/Disapproved by CGA's Transactions Group
| |
Jul |
Aug |
Sept |
Oct |
Nov |
Dec |
Jan |
Feb |
Mar |
Apr |
May |
Jun |
|
FY 2026 |
1,525 |
|
|
|
|
|
|
|
|
|
|
|
|
FY 2024 |
1,216 |
1,376 |
1,886 |
1,535 |
1,928 |
1,690 |
1,478 |
1,628 |
1,497 |
1,658 |
1,822 |
2,018 |
|
FY 2025 |
1,735 |
1,636 |
2,041 |
1,997 |
1,591 |
1,624 |
1,587 |
1,585 |
1,544 |
1,678 |
1,815 |
1,829 |
Reports Group
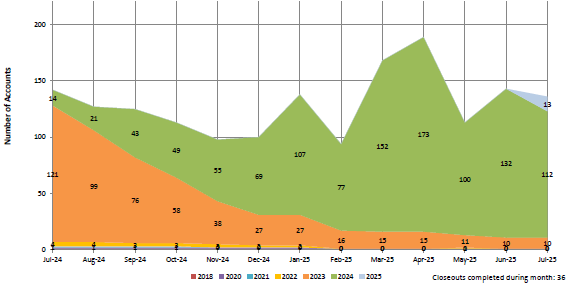
Late Closeouts - Not Yet Completed
Operational Goal: Close RC accounts within 180 days past account expiration date.
| |
2018 |
2020 |
2021 |
2022 |
2023 |
2024 |
2025 |
Total |
| Late Closeouts Pending Per Year (2018-2025) |
1 |
0 |
0 |
0 |
10 |
112 |
13 |
136 |
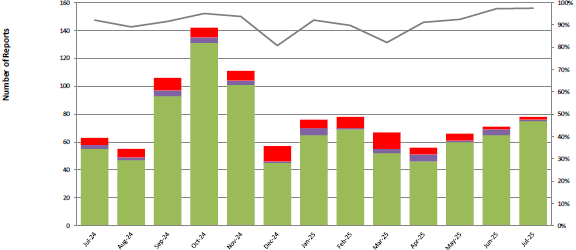
Final Financial Reports Completed
Goal: Complete on time, 60-90 days after end date
| |
Jul 2024 |
Aug 2024 |
Sep 2024 |
Oct 2024 |
Nov 2024 |
Dec 2024 |
Jan 2025 |
Feb 2025 |
Mar 2025 |
Apr 2025 |
May 2025 |
Jun 2025 |
Jul 2025 |
|
Not Yet Completed |
5 |
6 |
9 |
7 |
7 |
11 |
6 |
8 |
12 |
5 |
5 |
2 |
2 |
|
Late Completed |
3 |
2 |
4 |
4 |
3 |
1 |
5 |
1 |
3 |
5 |
1 |
4 |
1 |
|
Completed |
55 |
47 |
93 |
131 |
101 |
45 |
65 |
69 |
52 |
46 |
60 |
65 |
75 |
| % Finals Completed |
92% |
89% |
92% |
95% |
94% |
81% |
92% |
90% |
82% |
91% |
92% |
97% |
97% |
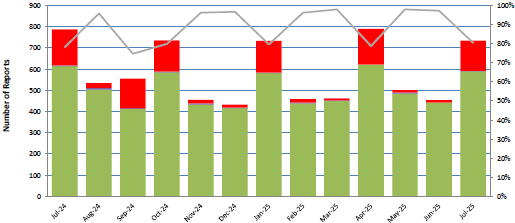
Other Financial Reports Completed
Other financial reports include month, quarter, semi-annual, and annual period reports
| |
Jul 2024 |
Aug 2024 |
Sep 2024 |
Oct 2024 |
Nov 2024 |
Dec 2024 |
Jan 2025 |
Feb 2025 |
Mar 2025 |
Apr 2025 |
May 2025 |
Jun 2025 |
Jul 2025 |
|
Not Yet Completed |
171 |
22 |
140 |
148 |
17 |
14 |
149 |
17 |
9 |
168 |
10 |
12 |
143 |
|
Late Completed |
3 |
8 |
3 |
3 |
6 |
2 |
2 |
4 |
3 |
0 |
7 |
0 |
2 |
|
Completed |
614 |
504 |
413 |
585 |
433 |
416 |
582 |
438 |
450 |
622 |
484 |
442 |
590 |
| % Finals Completed |
78% |
96% |
75% |
80% |
96% |
97% |
80% |
96% |
98% |
79% |
98% |
97% |
81% |
Cash Management Group
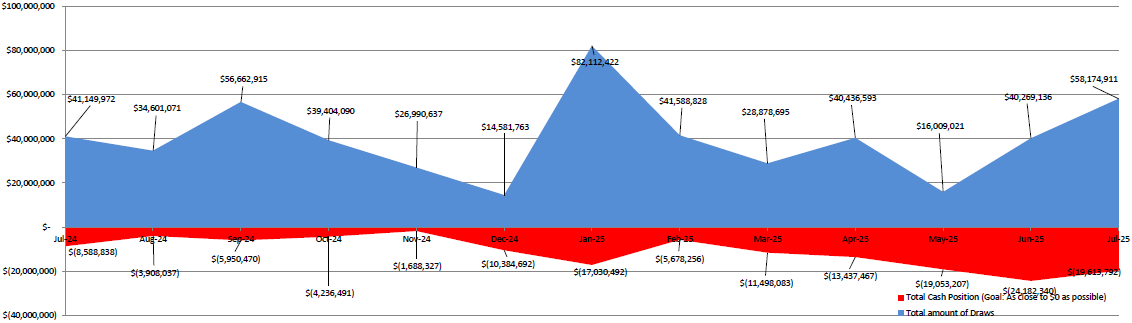
Goal: To draw cash at least 2 times per month per agency, complete final financial reports within 90 days, and close accounts in KFS within 6 months.
Cash Draws and Cash Position LOC
| |
Jul 2024 |
Aug 2024 |
Sep 2024 |
Oct 2024 |
Nov 2024 |
Dec 2024 |
Jan 2025 |
|
Total Amount of Draws |
$41,149,972 |
$34,601,071 |
$56,662,915 |
$39,404,090 |
$26,990,637 |
$14,581,763 |
$82,112,422 |
|
Total Cash Position |
-$8,588,838 |
-$3,908,037 |
-$5,950,470 |
-$13,658,489 |
-$1,688,327 |
-$10,384,692 |
-$17,030,492 |
| |
Feb 2025 |
Mar 2025 |
Apr 2025 |
May 2025 |
Jun 2025 |
Jul 2025 |
|
Total Amount of Draws |
$41,588,828 |
$28,878,695 |
$40,436,593 |
$16,009,021 |
$40,269,136 |
$58,174,911 |
|
Total Cash Position |
-$5,678,256 |
-$11,498,083 |
-$13,437,467 |
-$19,053,207 |
-$24,182,340 |
-$19,613,792 |
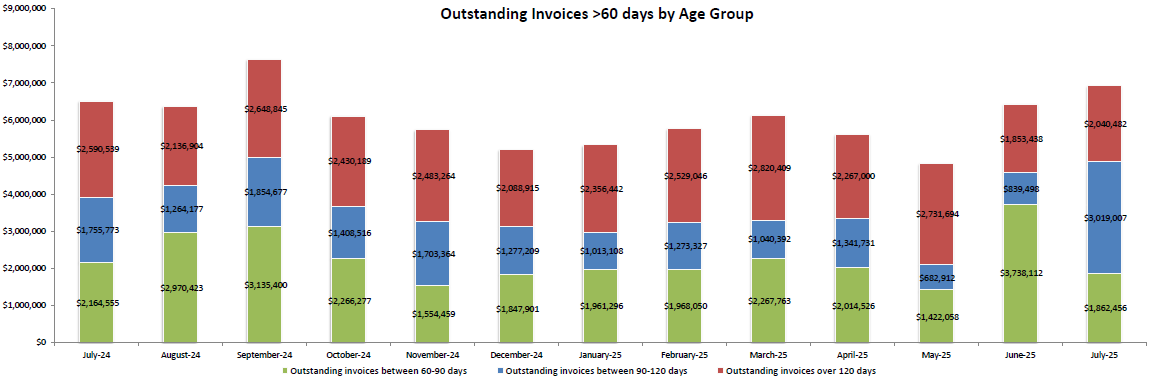
Outstanding Invoices >60 Days by Age Group
| |
Jul 2024 |
Aug 2024 |
Sep 2024 |
Oct 2024 |
Nov 2024 |
Dec 2024 |
Jan 2025 |
|
> 120 days |
$2,590,539 |
$2,136,904 |
$2,648,845 |
$2,430,264 |
$2,483,264 |
$2,088,915 |
$2,356,442 |
|
90 - 120 days |
$1,755,773 |
$1,264,177 |
$1,854,677 |
$1,408,516 |
$1,703,364 |
$1,277,209 |
$1,013,108 |
|
60 - 90 days |
$2,164,555 |
$2,970,423 |
$3,135,400 |
$2,266,277 |
$1,554,459 |
$1,847,901 |
$1,961,296 |
| |
Feb 2025 |
Mar 2025 |
Apr 2025 |
May 2025 |
Jun 2025 |
Jul 2025 |
|
> 120 days |
$2,529,046 |
$2,820,409 |
$2,267,000 |
$2,731,694 |
$1,853,438 |
$2,040,482 |
|
90 - 120 days |
$1,273,327 |
$1,040,392 |
$1,341,731 |
$682,912 |
$839,498 |
$3,019,007 |
|
60 - 90 days |
$1,968,050 |
$2,267,763 |
$2,014,526 |
$1,422,058 |
$3,738,112 |
$1,862,456 |
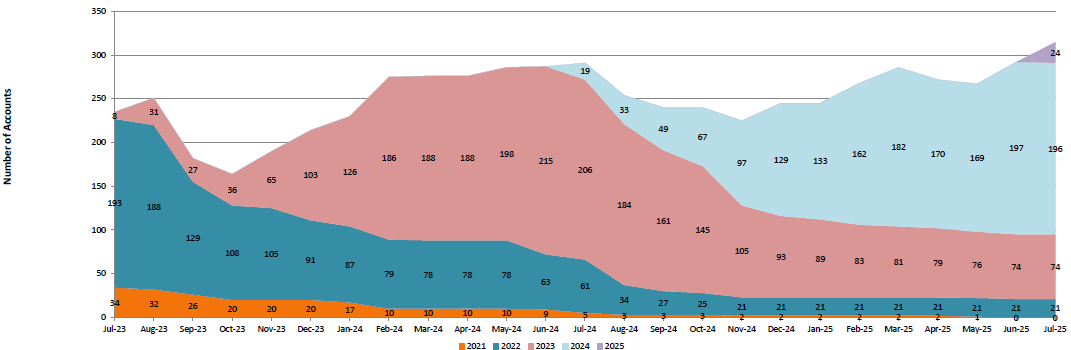
Late Closeouts - Not Yet Completed
| |
2022 |
2023 |
2024 |
2025 |
Total |
| Late Closeouts Pending Per Year |
21 |
74 |
196 |
24 |
315 |
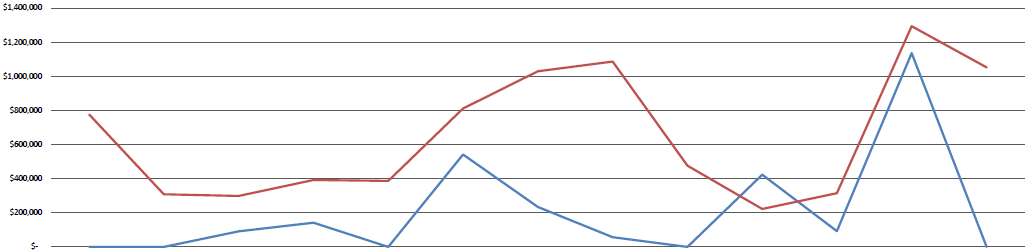
Holding Account Balance
| |
Jul 2024 |
Aug 2024 |
Sep 2024 |
Oct 2024 |
Nov 2024 |
Dec 2024 |
Jan 2025 |
|
Deposits |
$- |
$- |
$91,119 |
$142,139 |
$- |
$541,885 |
$234,672 |
|
End Balance |
$775,819 |
$308,018 |
$298,339 |
$391,894 |
$386,899 |
$811,769 |
$1,030,033 |
| |
Feb 2025 |
Mar 2025 |
Apr 2025 |
May 2025 |
Jun 2025 |
Jul 2025
|
|
Deposits |
$56,652 |
$- |
$423,212 |
$92,537 |
$1,136,547 |
$- |
|
End Balance |
$1,086,685 |
$475,646 |
$222,339 |
$314,876 |
$1,294,448 |
$1,052,565 |
Point of Service Survey Responses
Proposal Survey Responses by Month
From February 1, 2024 through July 31, 2025 we received approximately 988 unique survey responses from individuals who worked with OSP on a proposal submission. During this period, more than 99% of responses indicated satisfaction with the following four statements:
- Helped in a timely manner
- Provided with useful/accurate information
- Treated courteously
- Satisfied with the interaction
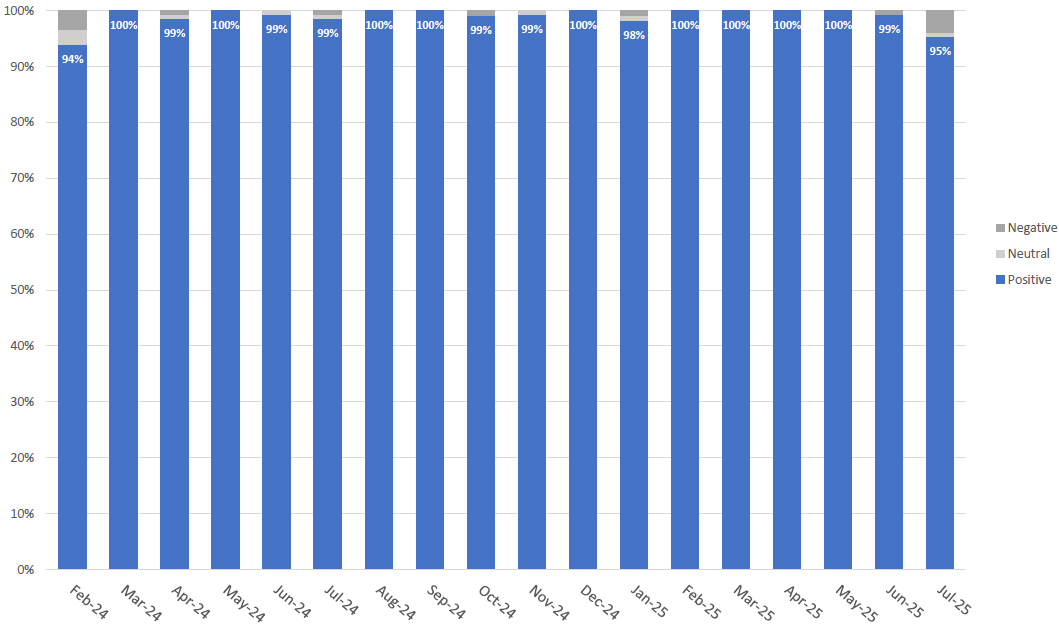
Individuals also provided 382 comments, the overwhelming majority of which were positive.
KR System Responses by Month
A question on satisfaction with the KR System was added to the survey in July 2017. The percentage of positive responses has increased since KR implementation.
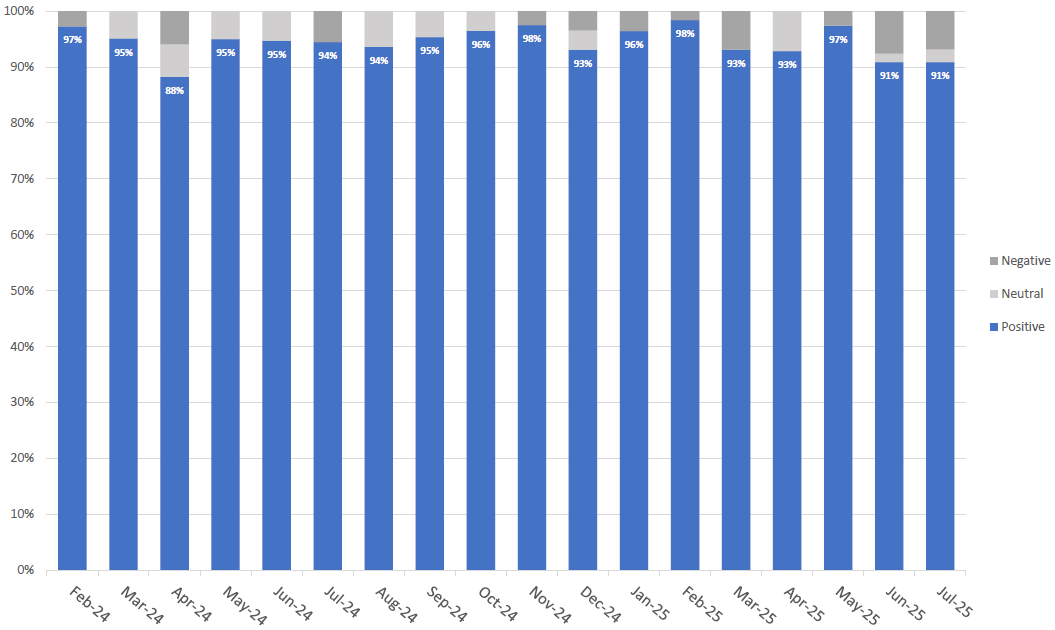
The KR Upgrade was implemented on April 25, 2022, resulting in lower satisfaction scores for May-22, as users adjusted to changes and issues were identified.
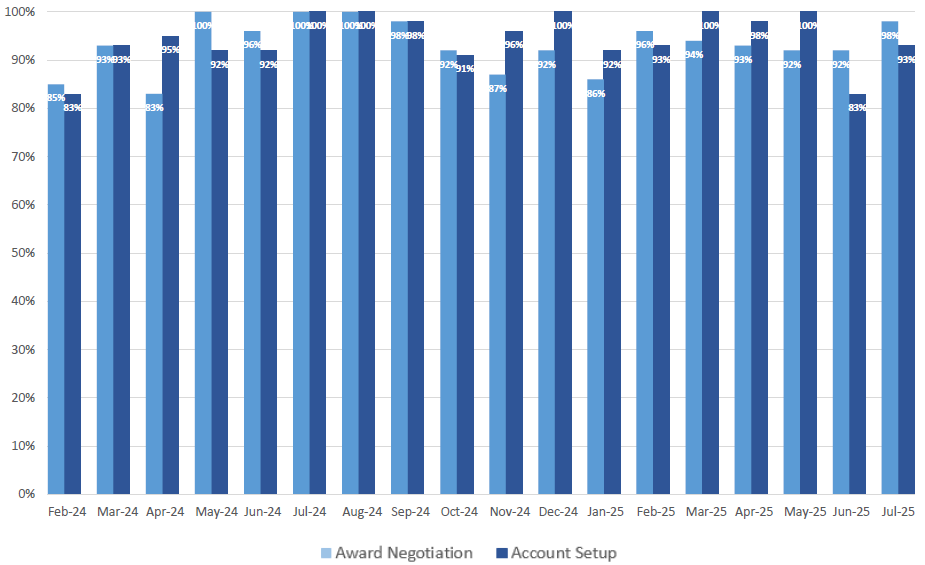
Award Negotiation & Account Setup Survey
From February 1, 2024 through July 31, 2025, we received 589 unique responses from participants interacting with personnel from OSP and CGA on award negotiation and account setup activities. Overall, 94% of responses indicated satisfaction with the award negotiation and account setup processes.
The award negotiation and account setup survey chart shows the combined positive and neutral response percentages by month to the following statements:
- Kept informed
- Treated courteously
- Satisfied with the interaction
CGA Client Satisfaction Survey
The CGA Client Satisfaction Survey seeks input from select campus clients in order to evaluate and improve CGA processes. Within the last calendar year, we received 144 unique responses from individuals who worked with CGA on post-award services, a response rate of 4%.
For the CGA Post-Award Survey, individuals either strongly agreed or agreed with the following four statements:
- Received a timely response
- Account Modification: 87%
- Expense Processing: 81%
- Final Financial Reporting: 86%
- Account Closeout: 89%
- Satisfied with the turnaround time
- Account Modification: 87%
- Expense Processing: 73%
- Final Financial Reporting: 83%
- Account Closeout: 89%
- Received clear explanations
- Account Modification: 87%
- Expense Processing: 76%
- Final Financial Reporting: 86%
- Account Closeout: 89%
- Treated courteously
- Account Modification: 100%
- Expense Processing: 89%
- Final Financial Reporting: 89%
- Account Closeout: 97%
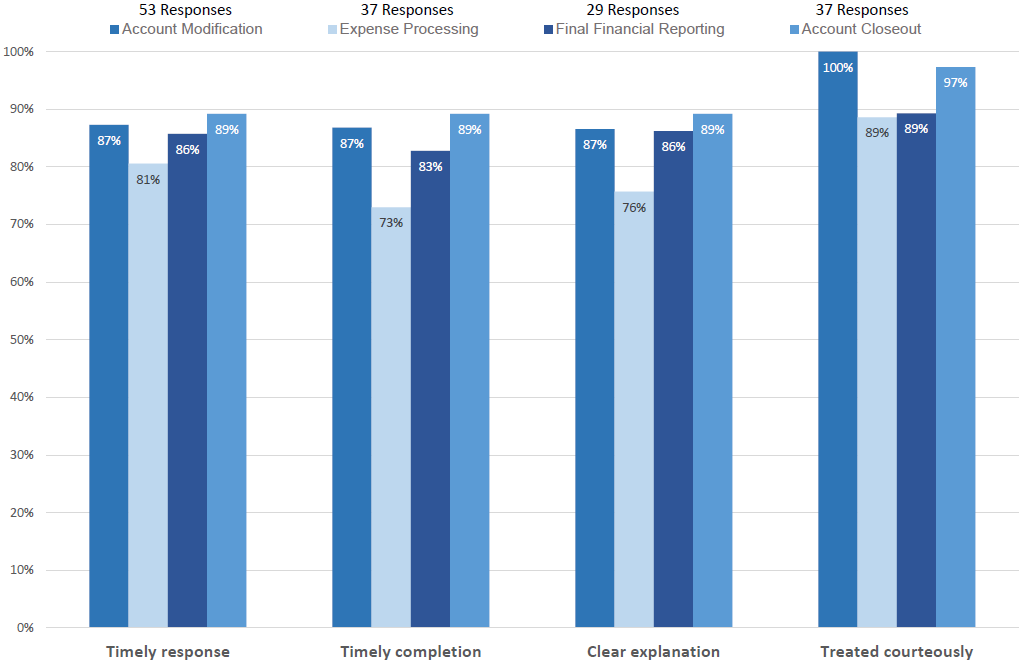
In addition to the ratings questions, respondents were asked to rate their overall satisfaction with CGA’s post-award services. 95% of individuals that responded indicated that they were either extremely satisfied or somewhat satisfied with CGA’s services.